Facebook
 Google
 GitHub
 Linkedin
Instrumentation and Process Control
Troubleshooting Problems in Control Systems
-
Question 1
In this process, two chemical streams are mixed together in a reactor vessel. The ensuing chemical reaction is exothermic (heat-producing) and must be cooled by a water cooling system to prevent overheating of the vessel and piping. A temperature transmitter (TT) senses the reaction product temperature and sends a 4-20 mA signal to a temperature indicating controller (TIC). The controller then sends a 4-20 mA control signal to the temperature valve (TV) to throttle cooling water flow:

Suppose something fails in the control valve mechanism to make it incapable of opening further than 80
Describe in detail the effect this fault will have on the performance of the cooling system.
Reveal answerThere will be no effect on the performance of this cooling system, except in circumstances where the controller tries to open the valve further than 80
Notes:This question is a good candidate for a “Virtual Troubleshooting” exercise. Presenting the diagram to students, you first imagine in your own mind a particular fault in the system. Then, you present one or more symptoms of that fault (something noticeable by an operator or other user of the system). Students then propose various diagnostic tests to perform on this system to identify the nature and location of the fault, as though they were technicians trying to troubleshoot the problem. Your job is to tell them what the result(s) would be for each of the proposed diagnostic tests, documenting those results where all the students can see.
During and after the exercise, it is good to ask students follow-up questions such as:
{\bullet} What does the result of the last diagnostic test tell you about the fault?
{\bullet} Suppose the results of the last diagnostic test were different. What then would that result tell you about the fault?
{\bullet} Is the last diagnostic test the best one we could do?
{\bullet} What would be the ideal order of tests, to diagnose the problem in as few steps as possible? -
Question 2
A very useful technique for testing process control loop response is to subject it to a “step-change” in controller output. In other words, the process is perturbed (the highly technical term for this is “bumped”) and the results recorded to learn more about its characteristics.
What practical concerns might surround “bumping” a process such as this? Remember, the process variable (PV) is a real physical measurement such as pressure, level, flow, temperature, pH, or any number of quantities. What precautions should you take prior to perturbing a process to check its response?
Reveal answerSome processes may not take well to “bumps,” especially large bumps. Imagine “bumping” the coolant flow to a nuclear reactor or the fuel flow to a large steam boiler: the results could be catastrophic! Not only is it a potential problem to exceed an operating limit (PV too high or too low) in a process, but it may be dangerous to exceed a certain rate of change over time.
Short of catastrophe, unacceptable variations in product quality may result from perturbations of the process. Again, these may be functions of absolute limit (PV too high or too low), and/or rates of change over time.
Remember, the purpose of regulatory control systems is to maintain the PV at or near setpoint. Any time the control system is disabled and the process purposely “bumped,” this purpose is defeated, if only momentarily. It is essential that operations personnel be consulted prior to manually perturbing a process, so that no safety or operating limit is exceeded in the tuning process.
Notes:A prime example of a process where rate-of-change is critical is temperature control in a high-pressure fluid system such as a catalytic reactor. Changing the temperature too fast will result in undue stress to welded pipe and vessel joints, and/or refractory linings.
An example of unacceptable variation might be pH control in an alcohol brewing process. If the pH of the “mash” drifts outside of narrow operating limits, the resulting alcohol will be of greatly diminished quality.
-
Question 3
Inspecting the trends of PV and SP on a process chart recorder, you notice the poor quality of control:
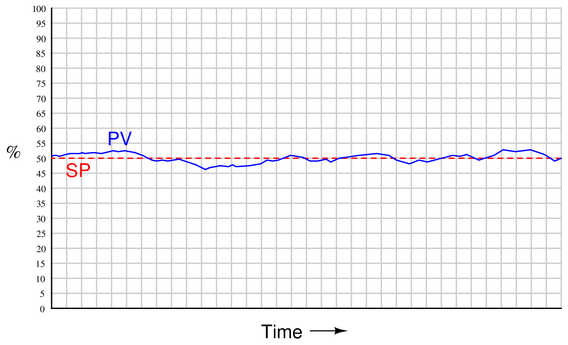
The “wandering” of the process variable (PV) around setpoint may be due to excessive action on the part of the controller, or it may be due to load fluctuations in the process itself. In other words, the instability may be the fault of the controller reacting too aggressively, or it may be that the controller is not working aggressively enough to counter changes in process load.
Identify a simple method to determine which scenario is true. Hint: the way to check is as simple as pushing a single button, in most cases.
Reveal answerPlace the controller in manual mode and observe the PV trend!
Notes:If the PV wanders even more with the controller in manual mode, then you know the controller was doing it’s job, though perhaps not aggressively enough. If the PV stops wanders less or stops wandering completely after the controller has been placed in manual mode, then you know the controller’s action is actually making matters worse.
Not all cases of controller over-tuning result in a nice sine-wave oscillation as some textbooks show! It is possible for an over-tuned controller to exhibit odd trend patterns, especially if the process has asymmetrical time constants (for example, a furnace that heats up faster than it cools down).
Also, it is possible for the PV to oscillate in a nice sine-wave pattern and not have it be the controller’s fault. If another control loop in a system is over-tuned and oscillating, for example, it may load the process you’re observing with a sine-wave disturbance, causing many process variables throughout the system to “ripple” correspondingly.
-
Question 4
The overhead pressure control system in this fractionator seems to have a problem. The controller (PIC-33) indicates the pressure being over setpoint by a substantial margin: the pressure reads 48 PSI while the setpoint is 37 PSI:

Identify the likelihood of each specified fault in this process. Consider each fault one at a time (i.e. no coincidental faults), determining whether or not each fault could independently account for all measurements and symptoms in this process.
$$\begin{array} {|l|l|} \hline Fault& Possible & Impossible \\ \hline PT-33~Calibration~error & & \\ \hline PY-33a~Calibration~error & & \\ \hline PY-33b~Calibration~error & & \\ \hline PV-33b~Block~valve~closed & & \\ \hline PV-33b~Bypass~valve~open & & \\ \hline Air~supply~to~PY-33b~failed & & \\ \hline Air~supply~to~FV-34~failed & & \\ \hline \end{array}$$
Reveal answer$$\begin{array} {|l|l|} \hline Fault & Possible & Impossible \\ \hline PT-33~Calibration~error & & \surd \\ \hline PY-33a~Calibration~error & & \surd \\ \hline PY-33b~Calibration~error & & \surd \\ \hline PV-33b~Block~valve~closed & \surd & \\ \hline PV-33b~Bypass~valve~open & & \surd \\ \hline Air~supply~to~PY-33b~failed & & \surd \\ \hline Air~supply~to~FV-34~failed & & \surd \\ \hline \end{array}$$
Notes:Control strategy based on that shown on page 1179 of B\‘ela Lipt\‘ak’s Instrument Engineer’s Handbook, Process Control, Third Edition. Embellishments added just to make the diagram more evil!
This question is a good candidate for a “Virtual Troubleshooting” exercise. Presenting the diagram to students, you first imagine in your own mind a particular fault in the system. Then, you present one or more symptoms of that fault (something noticeable by an operator or other user of the system). Students then propose various diagnostic tests to perform on this system to identify the nature and location of the fault, as though they were technicians trying to troubleshoot the problem. Your job is to tell them what the result(s) would be for each of the proposed diagnostic tests, documenting those results where all the students can see.
During and after the exercise, it is good to ask students follow-up questions such as:
{\bullet} What does the result of the last diagnostic test tell you about the fault?
{\bullet} Suppose the results of the last diagnostic test were different. What then would that result tell you about the fault?
{\bullet} Is the last diagnostic test the best one we could do?
{\bullet} What would be the ideal order of tests, to diagnose the problem in as few steps as possible? -
Question 5
The compressor emergency shutdown system (ESD) has tripped the natural gas compressor off-line three times in the past 24 hours. Each time the operator goes to reset the compressor interlock, she notices the graphic display panel on the interlock system says “Separator boot high level” as the reason for the trip. After this last trip, operations decides to keep the compressor shut down for a few hours until your arrival to diagnose the problem. Your first diagnostic test is to look at the indicated boot level in the sightglass (LG-93). There, you see a liquid level appears to be normal:

First, explain why this first diagnostic test was a good idea. Then, identify what would your next diagnostic test be.
Finally, comment on the decision by operations to leave the compressor shut down until your arrival. Do you think this was a good idea or a bad idea, from a diagnostic perspective? Why or why not?
Reveal answerGiven the fact that the ESD system keeps indicating a high boot level, you know that it “thinks” the liquid level inside the boot is higher than it should be. The next logical step is to determine whether or not a high liquid level condition does indeed exist. If so, the trip is legitimate and there may be a problem with the liquid level control system. If not, the LSHH-231 or its associated wiring may have a fault that sends a false trip alarm to the ESD system.
However, the decision to leave the compressor idle for a few hours until your arrival was not a good one for diagnosis. If indeed there is a problem with excessive liquid collecting in the boot, this would only be evident during running operation. With the compressor idle and no new gas entering the separator vessel, there will be no new liquid collecting in the boot, which will give the boot level control system ample time to empty that liquid down to a normal level and make it appear as though there is no level problem. In other words, leaving the compressor idle for a few hours “erases” the evidence, making it more difficult to troubleshoot.
Aside from re-starting the compressor and watching it run, you could perform a test on the liquid level control system by simulating a high-level condition inside the boot (e.g. applying pressure to one side of LT-92) and observing how fast or slow the actual liquid drains out (as indicated by LG-93). If there is a problem with the level control valve LV-92 or its associated components, you should be able to tell in the form of a long (slow) drain time. The fact that the blind flange at the bottom of the boot drain line says “Rod out” on the P&ID suggests this line is prone to plugging with debris, which could explain a slow-draining condition and consequently the frequent high-level trips.
Notes:This question is a good candidate for a “Virtual Troubleshooting” exercise. Presenting the diagram to students, you first imagine in your own mind a particular fault in the system. Then, you present one or more symptoms of that fault (something noticeable by an operator or other user of the system). Students then propose various diagnostic tests to perform on this system to identify the nature and location of the fault, as though they were technicians trying to troubleshoot the problem. Your job is to tell them what the result(s) would be for each of the proposed diagnostic tests, documenting those results where all the students can see.
During and after the exercise, it is good to ask students follow-up questions such as:
{\bullet} What does the result of the last diagnostic test tell you about the fault?
{\bullet} Suppose the results of the last diagnostic test were different. What then would that result tell you about the fault?
{\bullet} Is the last diagnostic test the best one we could do?
{\bullet} What would be the ideal order of tests, to diagnose the problem in as few steps as possible? -
Question 6
This P&ID shows an incinerator stack used to safely burn poisonous gases. The high temperature of the gas flame reduces the poisonous compounds to relatively harmless water vapor, carbon dioxide, and oxides of sulfur and nitrogen.
The incinerator was recently out of service for three full weeks being rebuilt. Following the rebuild, operations personnel have attempted to start the incinerator’s burner on plant fuel gas with no success. They can get it started with natural gas, but the burner management system keeps tripping whenever they switch to fuel gas. They call you to investigate.

Identify the likelihood of each specified fault in this process. Consider each fault one at a time (i.e. no coincidental faults), determining whether or not each fault could independently account for all measurements and symptoms in this process.
$$\begin{array} {|l|l|} \hline Fault & Possible & Impossible \\ \hline SV-115~Leaking~air & & \\ \hline PSL-105~Failed & & \\ \hline PSL-114~Failed & & \\ \hline PCV-39~Pressure~SP~too~low & & \\ \hline PCV-39~Pressure~SP~too~high & & \\ \hline PCV-40~Pressure~SP~too~low & & \\ \hline PCV-40~Pressure~SP~too~high & & \\ \hline ZS-38~Failed & & \\ \hline Blind~inserted~in~natural~gas~header & & \\ \hline Blind~inserted~in~fuel~gas~header & & \\ \hline \end{array}$$
Reveal answer$$\begin{array} {|l|l|} \hline Fault & Possible & Impossible \\ \hline SV-115~Leaking~air & & \surd \\ \hline PSL-105~Failed & & \surd \\ \hline PSL-114~Failed & & \surd \\ \hline PCV-39~Pressure~SP~too~low & & \surd \\ \hline PCV-39~Pressure~SP~too~high & & \surd \\ \hline PCV-40~Pressure~SP~too~low & \surd & \\ \hline PCV-40~Pressure~SP~too~high & \surd & \\ \hline ZS-38~Failed & & \surd \\ \hline Blind~inserted~in~natural~gas~header & & \surd \\ \hline Blind~inserted~in~fuel~gas~header & \surd & \\ \hline \end{array}$$
Notes:This question is a good candidate for a “Virtual Troubleshooting” exercise. Presenting the diagram to students, you first imagine in your own mind a particular fault in the system. Then, you present one or more symptoms of that fault (something noticeable by an operator or other user of the system). Students then propose various diagnostic tests to perform on this system to identify the nature and location of the fault, as though they were technicians trying to troubleshoot the problem. Your job is to tell them what the result(s) would be for each of the proposed diagnostic tests, documenting those results where all the students can see.
During and after the exercise, it is good to ask students follow-up questions such as:
{\bullet} What does the result of the last diagnostic test tell you about the fault?
{\bullet} Suppose the results of the last diagnostic test were different. What then would that result tell you about the fault?
{\bullet} Is the last diagnostic test the best one we could do?
{\bullet} What would be the ideal order of tests, to diagnose the problem in as few steps as possible? -
Question 7
In this process, steam is introduced into “stripping” vessel C-7 to help remove volatile sulfur compounds from “sour” water. The temperature of the stripped gases exiting the tower’s top is controlled by a pneumatic temperature control loop. Unfortunately, this loop seems to have a problem.
Temperature indicating recorder TIR-21 registers 304 °F, while temperature indicating controller TIC-21 registers 285 °F. The calibrated range of TT-21 is 100 to 350 °F. A technician connects a test gauge to the pneumatic signal line and reads a pressure of 12.8 PSI:

Which instrument is faulty: the transmitter, the recorder, or the controller, or is it impossible to tell from what little information is given here?
Reveal answerWe know the indicating controller (TIC-21) must be miscalibrated, because the pneumatic signal pressure of 12.8 PSI agrees with the recorder’s indication of 304 °F.
Notes:Predicting the effect of a given fault: present each of the following faults to the students, one at a time, having them comment on all the effects each fault would produce.
{\bullet} PC-115 left in manual mode
{\bullet} Isolation valve to PC-115 left in shut position
{\bullet} PV-115 has a positive calibration error (open further than it should be)
{\bullet} TT-21 has positive calibration error (outputs too high of a signal)
{\bullet} Bypass valve around TV-21 left open
{\bullet} LY-12 has negative calibration error (outputs too low of a signal)
{\bullet} Bypass valve around LV-12 left open
{\bullet} FT-28 fails with a low signal
{\bullet} FT-27 fails with a high signalIdentifying possible/impossible faults: present symptoms to the students and then have them determine whether or not a series of suggested faults could account for all the symptoms, explaining why or why not for each proposed fault:
Determining the utility of given diagnostic tests: imagine the ??? fails ??? in this system (but don’t tell this to students!). Present the operator’s observation(s) to the students, have them consider possible faults and diagnostic strategies, and then propose the following diagnostic tests one by one. Have students rate the value of each test, determining whether or not each test would give us useful information (i.e. tell us something we don’t already know). Also have students describe what re
{\bullet} — Yes/No
{\bullet} — Yes/NoDiagnosing a fault based on given symptoms: imagine the ??? fails ??? in this system (but don’t tell this to students!). Present the operator’s observation(s) to the students, have them consider possible faults and diagnostic strategies, and then tell them the results of tests they propose based on the following symptoms, until they have properly identified the nature and location of the fault:
-
Question 8
An operator reports a high level alarm (LAH-12) displayed at the control room for the last 13 hours of operation, in this sour water stripping tower unit (where sulfide-laden water is “stripped” of sulfur compounds by the addition of hot steam). Over that time period, the sightglass (level gauge LG-11) has shown the liquid level inside vessel C-406 drifting between 2 feet 5 inches and 2 feet 8 inches:
Identify the likelihood of each specified fault in this process. Consider each fault one at a time (i.e. no coincidental faults), determining whether or not each fault could independently account for all measurements and symptoms in this process.
$$\begin{array} {|l|l|} \hline Fault & Possible & Impossible \\ \hline LT-12~Miscalibrated & & \\ \hline LG-11~Block~valve(s)~shut & & \\ \hline LSH-12~Switch~failed & & \\ \hline LSL-12~Switch~failed & & \\ \hline Leak~in~tube~between~LT-12~and~LIC-12 & & \\ \hline LIC-12~Controller~SP~set~too~high & & \\ \hline LV-12~Control~valve~failed~open & & \\ \hline LV-12~Control~valve~failed~shut & & \\ \hline \end{array}$$
Reveal answer$$\begin{array} {|l|l|} \hline Fault & Possible & Impossible \\ \hline LT-12~Miscalibrated & & \surd \\ \hline LG-11~Block~valve(s)~shut & & \surd \\ \hline LSH-12~Switch~failed & \surd & \\ \hline LSL-12~Switch~failed & & \surd \\ \hline Leak~in~tube~between~LT-12~and~LIC-12 & & \surd \\ \hline LIC-12~Controller~SP~set~too~high & & \surd \\ \hline LV-12~Control~valve~failed~open & & \surd \\ \hline LV-12~Control~valve~failed~shut & & \surd \\ \hline \end{array}$$
Notes:\filbreak
Predicting the effect of a given fault: present each of the following faults to the students, one at a time, having them comment on all the effects each fault would produce.
{\bullet} PC-115 calibration zero-shift (thinks pressure is lower than it actually is)
{\bullet} PV-115 bench set 4-16 PSI instead of 3-15 PSI
{\bullet} Block valve upstream of PV-115 shut
{\bullet} Block valve downstream of PV-115 shut
{\bullet} Isolation valve between process line and PC-115 shut
{\bullet} PSV-353 lift pressure set to 55 PSI instead of 50 PSIIdentifying possible/impossible faults: present symptoms to the students and then have them determine whether or not a series of suggested faults could account for all the symptoms, explaining why or why not for each proposed fault:
{\bullet} Symptom:
{\bullet} — Yes/No
{\bullet} — Yes/No
{\bullet} — Yes/NoDetermining the utility of given diagnostic tests: present symptoms to the students and then propose the following diagnostic tests one by one. Students rate the value of each test, determining whether or not it would give useful information (i.e. tell us something we don’t already know). Students determine what different results for each test would indicate about the fault, if anything:
{\bullet} Symptom: PC-115 shows SP = 25 PSI ; PV = 2 PSI ; Output = 0
{\bullet} Check tower temperature at TIC-21— Yes
{\bullet} Check pressure at PG-406— Yes
{\bullet} Check pressure at PG-438— No
{\bullet} Inspect position of PV-115 valve stem— Yes
{\bullet} Check pressure at PG-312— No
{\bullet} Check pressure at PG-441— Yes
{\bullet} Check position of NC hand valve near PSV-353— Yes
{\bullet} Check position of block valve upstream of PV-115— No
{\bullet} Check position of block valve downstream of PV-115— NoDiagnosing a fault based on given symptoms: imagine the ??? fails ??? in this system (don’t reveal the fault to students!). Present the operator’s observation(s) to the students, have them consider possible faults and diagnostic strategies, and then tell them the results of tests they propose based on the following symptoms, until they have properly identified the nature and location of the fault:
{\bullet}
{\bullet}
{\bullet} -
Question 9
Pictured here is a P\&ID (Process and Instrument Diagram) of a liquid flow control “loop,” consisting of a flow transmitter (FT) to sense liquid flow rate through the pipe and output an electronic signal corresponding to the flow, a flow controller (FC) to sense the flow signal and decide which way the control valve should move, a current-to-air (I/P) transducer (FY) to convert the controller’s electronic output signal into a variable air pressure, and an air-operated flow control valve (FV) to throttle the liquid flow:

The actions of each instrument are shown here:
{\bullet} FT: increasing liquid flow = increasing current signal
{\bullet} FC: increasing process variable (input) signal = decreasing output signal
{\bullet} FY: increasing current input signal = increasing pneumatic output signal
{\bullet} FV: increasing pneumatic signal = open moreDescribe what will happen to all signals in this control loop with the controller in “automatic” mode (ready to compensate for any changes in flow rate by automatically moving the valve) if the pump were to suddenly spin faster and create more fluid pressure, causing an increase in flow rate.
Also describe what will happen to all signals in this control loop with the controller in “manual” mode (where the output signal remains set at whatever level the human operator sets it at) if the pump were to suddenly spin faster and create more fluid pressure, causing an increase in flow rate.
{\bullet} Explain the practical benefit of having a “manual” mode in a process loop controller. When might we intentionally use manual mode in an operating process condition?
Reveal answer{\bf In automatic mode:}
Process flow rate (increase) $\to$ FT output signal (increase milliamps) $\to$ FC output signal (decrease milliamps) $\to$ FY output signal (decrease PSI) $\to$ FV position (moves further closed, pinching off liquid flow).
{\bf In manual mode:}
Process flow rate (increase) $\to$ FT output signal (increase milliamps) $\to$ FC output signal (remains steady) $\to$ FY output signal (remains steady) $\to$ FV position (holds position).
The important part of this question is the difference in response between “automatic” and “manual” controller modes. In automatic control mode, the controller takes action to bring the process back to setpoint. In manual control mode, the controller just lets the process drift and takes no action to stop it.
At first, having a “manual” mode in a control system seems pointless. However, giving human operators the ability to manually override the otherwise automatic actions of a control system is important for start-up, shut-down, and handling emergency (unusual) conditions in a process system.
Manual mode is also a very important diagnostic tool for instrument technicians and operators alike. Being able to “turn off the brain” of an automatic control system and watch process response to manual changes in manipulated variable (final control element) signals gives technical personnel opportunity to test for unusual control valve behavior, process quirks, and other behaviors in a system that can lead to poor automatic control.
-
Question 10
In this process, maple syrup is heated as it passes through a steam heat exchanger, then enters an evaporator where the water boils off. The purpose of this is to raise the sugar concentration of the syrup, making it suitable for use as a food topping. A level control system (LT, LIC, and LV) maintains constant syrup level inside the evaporator, while an analytical control system (AT, AIR, AC, and AV) monitors the sugar concentration of the syrup and adjusts steam flow to the heat exchanger accordingly.

Suppose the steam tubes inside the heat exchanger become coated with residue from the raw maple syrup, making it more difficult for heat to transfer from the steam to the syrup. This makes the heat exchanger less efficient, which will undoubtedly affect the process.
Describe in detail the effect this heat exchanger problem will have on the performance of the analytical control system.
{\bullet} Suppose the operations personnel of this maple syrup processing facility wished to have an automatic method for detecting heat exchanger fouling. What variable(s) could be measured in this process to indicate a fouled heat exchanger?
{\bullet} What economic effect will this fouling have on the process? In other words, does the process become more or less profitable as a result of the heat exchanger fouling?Reveal answerThe analytical control system should still be able to maintain sugar concentration at setpoint, unless the heat exchanger fouling is so extreme that even a wide-open steam valve does not heat the incoming syrup enough to sufficiently concentrate it.
Follow-up question: suppose the heat exchanger fouling really is this bad, but we cannot fix the heat exchanger with the tools we have available. What would you recommend the operator do to make this system produce on-spec syrup?
Notes:The operator could reduce the incoming feed rate to allow the fouled heat exchanger to sufficiently heat the incoming syrup.
This question is a good candidate for a “Virtual Troubleshooting” exercise. Presenting the diagram to students, you first imagine in your own mind a particular fault in the system. Then, you present one or more symptoms of that fault (something noticeable by an operator or other user of the system). Students then propose various diagnostic tests to perform on this system to identify the nature and location of the fault, as though they were technicians trying to troubleshoot the problem. Your job is to tell them what the result(s) would be for each of the proposed diagnostic tests, documenting those results where all the students can see.
During and after the exercise, it is good to ask students follow-up questions such as:
{\bullet} What does the result of the last diagnostic test tell you about the fault?
{\bullet} Suppose the results of the last diagnostic test were different. What then would that result tell you about the fault?
{\bullet} Is the last diagnostic test the best one we could do?
{\bullet} What would be the ideal order of tests, to diagnose the problem in as few steps as possible? -
Question 11
In this process, maple syrup is heated as it passes through a steam heat exchanger, then enters an evaporator where the water boils off. The purpose of this is to raise the sugar concentration of the syrup, making it suitable for use as a food topping. A level control system (LT, LIC, and LV) maintains constant syrup level inside the evaporator, while an analytical control system (AT, AIR, AC, and AV) monitors the sugar concentration of the syrup and adjusts steam flow to the heat exchanger accordingly.

Suppose the syrup analyzer (AT) suffers a sudden calibration problem, causing it to register too low (telling the analytical controller that the sugar concentration of the syrup is less than it actually is).
Describe in detail the effect this calibration error will have on the performance of the analytical control system.
{\bullet} What economic effect will this mis-calibration have on the process? In other words, does the process become more or less profitable as a result of this change?
{\bullet} Suppose someone shuts the manual block valve on the steam line just a little bit, so that it is about 80Reveal answerThe syrup’s sugar concentration will eventually become excessive as the analytical controller (AC) attempts to maintain setpoint.
Notes:This question is a good candidate for a “Virtual Troubleshooting” exercise. Presenting the diagram to students, you first imagine in your own mind a particular fault in the system. Then, you present one or more symptoms of that fault (something noticeable by an operator or other user of the system). Students then propose various diagnostic tests to perform on this system to identify the nature and location of the fault, as though they were technicians trying to troubleshoot the problem. Your job is to tell them what the result(s) would be for each of the proposed diagnostic tests, documenting those results where all the students can see.
During and after the exercise, it is good to ask students follow-up questions such as:
{\bullet} What does the result of the last diagnostic test tell you about the fault?
{\bullet} Suppose the results of the last diagnostic test were different. What then would that result tell you about the fault?
{\bullet} Is the last diagnostic test the best one we could do?
{\bullet} What would be the ideal order of tests, to diagnose the problem in as few steps as possible? -
Question 12
Consider this control system, set up to maintain the temperature of a chemical reactor vessel at a constant (“setpoint”) value. The reactor’s source of heat is a steam “jacket” where hot steam is admitted through a motor-operated (M) control valve (TV) according to the temperature inside the reactor sensed by the temperature transmitter (TT):

You arrive at work one day to find the operator very upset. The last batch of product emptied from the reactor was out of spec, as though the temperature were too cold, yet the controller (TIC) displays the temperature to be right at setpoint where it should be: 175 °F.
Your first step is to go to the reactor and look at the temperature indicating gauge (TI) mounted near the same point as the temperature transmitter. It registers a temperature of only 137 °F.
From this information, determine what is the most likely source of the problem, and explain how you made that determination.
{\bullet} Why was it a good decision to consult the temperature gauge (TI) on the reactor as a first diagnostic step?
{\bullet} Suppose a fellow instrument technician were to suggest to you that the problem in this system could be a controller configured for the wrong action (e.g. direct action instead of reverse action). Do you think this is a plausible explanation for the symptoms reported here? Why or why not?
{\bullet} Could the problem be that someone left the controller in manual mode rather than automatic mode as it should be? Explain why or why not.
{\bullet} Based on the P\&ID shown, are the instruments pneumatic or electronic?
{\bullet} Given the fact that we know this reactor is steam-heated, is it possible to conclude that the chemical reaction taking place inside it is either endothermic (heat-absorbing) or exothermic (heat-releasing)?
{\bullet} Safety shutdown systems often use a “two-out-of-three” (2oo3) voting algorithm to select the best measurement from three redundant transmitters. Explain how this same concept may be applied by the instrument technician in the course of troubleshooting the problem.Reveal answerThe problem most likely lies with the temperature transmitter (TT).
An important diagnostic principle here is that of a two-out-of-three vote. By comparing three sources of information on the same variable and determining the majority agreement, we are able to better discern the actual value of that variable despite faults in the equipment. The technician must determine which instrument is faulted based on a comparison of three points of data: two instruments (indicating controller and gauge) and the operator’s assessment of the product batch. Since two out of these three data sources agree (batch quality and temperature gauge), the most likely fault is in the temperature transmitter/indicating controller loop.
An alternative possibility to the transmitter being bad is a mis-calibration of the controller’s process variable input, causing it to register falsely high even if it receives the correct milliamp signal from the transmitter. Another possibility is the primary sensing element (RTD, thermocouple, etc.) being faulty, sending the transmitter an incorrect signal.
Notes:This question is a good candidate for a “Virtual Troubleshooting” exercise. Presenting the diagram to students, you first imagine in your own mind a particular fault in the system. Then, you present one or more symptoms of that fault (something noticeable by an operator or other user of the system). Students then propose various diagnostic tests to perform on this system to identify the nature and location of the fault, as though they were technicians trying to troubleshoot the problem. Your job is to tell them what the result(s) would be for each of the proposed diagnostic tests, documenting those results where all the students can see.
During and after the exercise, it is good to ask students follow-up questions such as:
{\bullet} What does the result of the last diagnostic test tell you about the fault?
{\bullet} Suppose the results of the last diagnostic test were different. What then would that result tell you about the fault?
{\bullet} Is the last diagnostic test the best one we could do?
{\bullet} What would be the ideal order of tests, to diagnose the problem in as few steps as possible? -
Question 13
Examine this P&ID for a level control system in a vessel where two different fluids (Feed A and Feed B) are mixed together:

Determine the effect on the control system’s regulation of liquid level inside the vessel if an instrument technician accidently mis-configures the controller for the wrong type of action (e.g. direct action when it should be reverse, or vice-versa). Assume all other loop components are properly configured and that the controller is well-tuned.
Reveal answerThe liquid mixing vessel will either drain completely or overflow, depending on which side of setpoint the process variable was on at the time of the mis-configuration.
Notes:This question is a good candidate for a “Virtual Troubleshooting” exercise. Presenting the diagram to students, you first imagine in your own mind a particular fault in the system. Then, you present one or more symptoms of that fault (something noticeable by an operator or other user of the system). Students then propose various diagnostic tests to perform on this system to identify the nature and location of the fault, as though they were technicians trying to troubleshoot the problem. Your job is to tell them what the result(s) would be for each of the proposed diagnostic tests, documenting those results where all the students can see.
During and after the exercise, it is good to ask students follow-up questions such as:
{\bullet} What does the result of the last diagnostic test tell you about the fault?
{\bullet} Suppose the results of the last diagnostic test were different. What then would that result tell you about the fault?
{\bullet} Is the last diagnostic test the best one we could do?
{\bullet} What would be the ideal order of tests, to diagnose the problem in as few steps as possible? -
Question 14
Examine this P&ID for a level control system in a vessel where two different fluids (Feed A and Feed B) are mixed together:

Determine the effect on the control system’s regulation of liquid level inside the vessel if an instrument technician accidently mis-calibrates the control valve such that it opens 2
Reveal answerThere will be no adverse effect resulting from this mis-calibration, unless the valve is unable to achieve a full-closed position when required. In such a case, the liquid level will slowly fall below setpoint.
Notes:This question is a good candidate for a “Virtual Troubleshooting” exercise. Presenting the diagram to students, you first imagine in your own mind a particular fault in the system. Then, you present one or more symptoms of that fault (something noticeable by an operator or other user of the system). Students then propose various diagnostic tests to perform on this system to identify the nature and location of the fault, as though they were technicians trying to troubleshoot the problem. Your job is to tell them what the result(s) would be for each of the proposed diagnostic tests, documenting those results where all the students can see.
During and after the exercise, it is good to ask students follow-up questions such as:
{\bullet} What does the result of the last diagnostic test tell you about the fault?
{\bullet} Suppose the results of the last diagnostic test were different. What then would that result tell you about the fault?
{\bullet} Is the last diagnostic test the best one we could do?
{\bullet} What would be the ideal order of tests, to diagnose the problem in as few steps as possible? -
Question 15
In this process, maple syrup is heated as it passes through a steam heat exchanger, then enters an evaporator where the water boils off. The purpose of this is to raise the sugar concentration of the syrup, making it suitable for use as a food topping. A level control system (LT, LIR, LIC, and LV) maintains constant syrup level inside the evaporator, while an analytical control system (AT, AIR, AIC, and AV) monitors the sugar concentration of the syrup and adjusts steam flow to the heat exchanger accordingly.
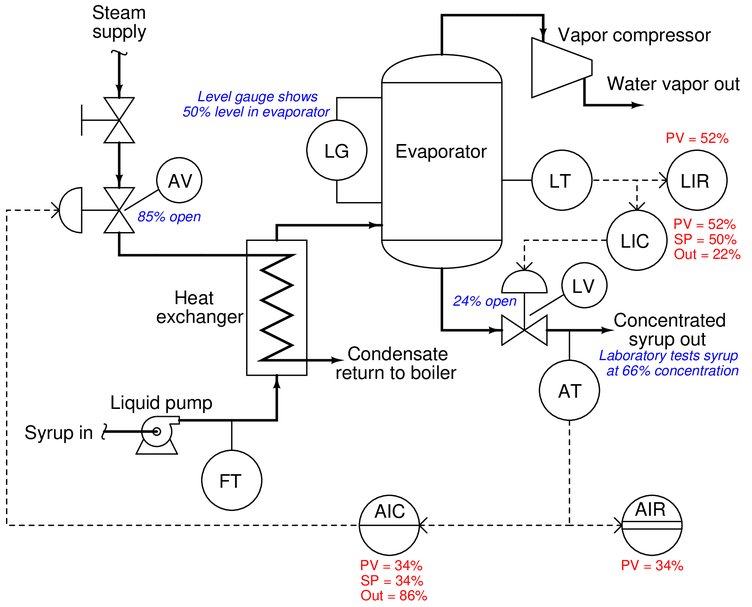
Examine the live variable values shown in the above diagram, and then determine where any problems may exist in this syrup concentrating system.
{\bullet} A valuable principle to apply in a diagnostic scenario such as this is correspondence: identifying which variables correspond at different points within the system, and which do not. Apply this comparative test to the variables scenario shown in the diagram, and use the results to defend your answer of where the problem is located and what type of problem it is.
Reveal answerThe one glaring discrepancy we see here is between the laboratory’s measurement of syrup concentration and what the AIC and AIR indicate. Given that both the AIC and AIR agree with each other on PV value, we may conclude that the signal to both of these instruments corresponds to a 34
We also see some minor discrepancies between controller output indications and actual valve stem positions, but these are small enough to ignore. Likewise, the discrepancy between the level gauge (LG) indication and the level controller/recorder indications is small enough that it does not pose a serious problem.
Notes:{\bullet} Explain why the AIR cannot be at fault in this scenario.
{\bullet} Explain why the AIC cannot be at fault in this scenario.
{\bullet} Explain why the steam supply cannot be at fault in this scenario. -
Question 16
In this process, two chemical streams are mixed together in a reactor vessel. The ensuing chemical reaction is exothermic (heat-producing) and must be cooled by a water cooling system to prevent overheating of the vessel and piping. A temperature transmitter (TT) senses the reaction product temperature and sends a 4-20 mA signal to a temperature indicating controller (TIC). The controller then sends a 4-20 mA control signal to the temperature valve (TV) to throttle cooling water flow:

Suppose operators decide to increase production in this process reactor. This means the incoming feed flow rates will be increased, producing more heat.
Describe in detail how the cooling system will respond to this change in process operations.
Reveal answerThe controller should still be able to maintain the process temperature at setpoint, but it will have to open the cooling water valve further than usual to do so.
Notes:This question is a good candidate for a “Virtual Troubleshooting” exercise. Presenting the diagram to students, you first imagine in your own mind a particular fault in the system. Then, you present one or more symptoms of that fault (something noticeable by an operator or other user of the system). Students then propose various diagnostic tests to perform on this system to identify the nature and location of the fault, as though they were technicians trying to troubleshoot the problem. Your job is to tell them what the result(s) would be for each of the proposed diagnostic tests, documenting those results where all the students can see.
During and after the exercise, it is good to ask students follow-up questions such as:
{\bullet} What does the result of the last diagnostic test tell you about the fault?
{\bullet} Suppose the results of the last diagnostic test were different. What then would that result tell you about the fault?
{\bullet} Is the last diagnostic test the best one we could do?
{\bullet} What would be the ideal order of tests, to diagnose the problem in as few steps as possible? -
Question 17
There is a problem somewhere in this liquid flow control system. The controller is in automatic mode, with a setpoint of 65

Explain how you would begin troubleshooting this system, and what possible faults could account for the controller not being able to maintain liquid flow at setpoint.
{\bullet} Explain how you could divide this control system into distinct areas or zones which you may then begin to refer to when “dividing and conquering” the problem.
Reveal answerOne possible fault has to do with the control valve: perhaps something has happened to make it fail closed (loss of air supply, signal, etc.). Other possible problems include the following:
{\bullet} Pump not running (no source of fluid power to motivate flow)\
{\bullet} Very poor controller tuning
{\bullet} Wrong controller action
{\bullet} Valve failed closed (loss of air supply, signal, etc.)
{\bullet} Transmitter failed, showing no flow when in fact there isA good “first test” for troubleshooting the loop is to check the controller output: is it trying to open up the valve?
Notes:This question is a good candidate for a “Virtual Troubleshooting” exercise. Presenting the diagram to students, you first imagine in your own mind a particular fault in the system. Then, you present one or more symptoms of that fault (something noticeable by an operator or other user of the system). Students then propose various diagnostic tests to perform on this system to identify the nature and location of the fault, as though they were technicians trying to troubleshoot the problem. Your job is to tell them what the result(s) would be for each of the proposed diagnostic tests, documenting those results where all the students can see.
During and after the exercise, it is good to ask students follow-up questions such as:
{\bullet} What does the result of the last diagnostic test tell you about the fault?
{\bullet} Suppose the results of the last diagnostic test were different. What then would that result tell you about the fault?
{\bullet} Is the last diagnostic test the best one we could do?
{\bullet} What would be the ideal order of tests, to diagnose the problem in as few steps as possible? -
Question 18
This water filter level control system uses an ultrasonic level transmitter to sense the level of water in the filter, and a controller to drive a motor-actuated valve introducing raw water to be filtered:

Assuming a direct-acting level transmitter (increasing filter level = increasing signal), and a signal-to-open control valve (increasing controller output signal = wider open valve), determine whether the level controller needs to be configured for direct-action or reverse-action, and explain your reasoning. Annotate the diagram with “+” and “-” symbols next to the PV and SP controller inputs to show more explicitly the relationships between the controller inputs and output.
Next, determine the response of the controller to the following situations. In other words, determine what the controller’s output signal will do when this water level control system is affected in the following ways:
{\bullet} A sudden increase in effluent flow rate (clean water demand)
{\bullet} Level transmitter fails high (indicating 100
{\bullet} Control valve actuator fails, driving valve fully open (ignoring controller signal)
{\bullet} Re-draw the diagram for this water filter level control system, replacing the controller (circle) with an op-amp symbol (triangle), determining the “+” and “-” input assignments on the opamp for PV and SP.
{\bullet} Explain why level control is important in a water filter such as this.
{\bullet} What do the “H” and “L” symbols near the LIR represent?
Reveal answerThis controller needs to be reverse-acting:

Some control system diagrams use an op-amp symbol in place of the ISA-standard circle used to represent a loop controller:
{\bullet} A sudden increase in effluent flow rate (clean water demand): controller output increases
{\bullet} Level transmitter fails high (indicating 100 at all times): controller output decreases
{\bullet} Control valve actuator fails, driving valve fully open (ignoring controller signal): controller output decreases
Notes:This question is a good candidate for a “Virtual Troubleshooting” exercise. Presenting the diagram to students, you first imagine in your own mind a particular fault in the system. Then, you present one or more symptoms of that fault (something noticeable by an operator or other user of the system). Students then propose various diagnostic tests to perform on this system to identify the nature and location of the fault, as though they were technicians trying to troubleshoot the problem. Your job is to tell them what the result(s) would be for each of the proposed diagnostic tests, documenting those results where all the students can see.
During and after the exercise, it is good to ask students follow-up questions such as:
{\bullet} What does the result of the last diagnostic test tell you about the fault?
{\bullet} Suppose the results of the last diagnostic test were different. What then would that result tell you about the fault?
{\bullet} Is the last diagnostic test the best one we could do?
{\bullet} What would be the ideal order of tests, to diagnose the problem in as few steps as possible?{\bf Summary Quiz:}
Suppose someone dumps a bunch of soap in the water headed for the filtration plant, resulting in a thin but dense layer of foamy bubbles floating on top of the water. The ultrasonic level transmitter, which uses sound waves to measure distance, senses this foam. What effect will this have on the actual water level in the filter over time, due to the control system’s action?
{\bullet} There will be no ill effect—the liquid level will be right on setpoint
{\bullet} The actual liquid level will be a bit more than it should
{\bullet} The actual liquid level will oscillate above and below setpoint
{\bullet} The water filter will run completely dry (no liquid)
{\bullet} The actual liquid level will be a bit less than it should
{\bullet} The water filter will completely overflow with liquid
-
Question 19
In this process, two chemical streams are mixed together in a reactor vessel. The ensuing chemical reaction is exothermic (heat-producing) and must be cooled by a water cooling system to prevent overheating of the vessel and piping. A temperature transmitter (TT) senses the reaction product temperature and sends a 4-20 mA signal to a temperature indicating controller (TIC). The controller then sends a 4-20 mA control signal to the temperature valve (TV) to throttle cooling water flow:

Suppose an instrument technician adds a temperature-indicating chart recorder (TIR) to the temperature transmitter circuit, necessitating the addition of a 250 ohm resistor to the 4-20 mA circuit to provide a 1-5 volt voltage signal which the recorder can read. Now the 4-20 mA temperature circuit has more resistance in it than it did before.
Describe in detail the effect this circuit modification will have on the performance of the cooling system.
Reveal answerThis circuit modification will have absolutely no effect on the performance of the system, as long as the loop-powered transmitter receives its minimum terminal voltage for proper operation.
Notes:Some students may think the additional 250 ohms will decrease current, resulting in a too-cool reading of temperature. However, this is not how 4-20 mA current circuits work!
-
Question 20
Consider this control system, set up to maintain the temperature of a chemical reactor vessel at a constant (“setpoint”) value. The reactor’s source of heat is a steam “jacket” where hot steam is admitted through a motor-operated (M) control valve (TV) according to the temperature inside the reactor sensed by the temperature transmitter (TT):

While doing some clean-up work near the reactor, you receive a frantic call from the operator on your two-way radio. He says that the controller (TIC) is registering a temperature of 186 °F, which is 11 degrees higher than the setpoint of 175 °F. A temperature this high could ruin the product inside the reactor. He wants you to check the temperature indicator on the side the reactor (TI) and let him know what it reads.
You look at the TI, and see that it registers a temperature of 172 °F, which is a bit too cold if anything, not too hot. You immediately report this to the operator using your radio, who then asks you to check out the system to see why he’s getting a false reading on the controller display.
Fortunately, you have your multimeter and tool set with you, so you proceed to the temperature transmitter to measure the milliamp signal it is outputting. Removing a cover from a round junction box on the conduit where the transmitter’s wires are routed, you see a terminal block inside with a 1N4001 rectifying diode placed in series with the circuit:
Setting your multimeter to measure milliamps, you connect the red and black test leads across the diode. This shorts past the diode, forcing all the current to go through the meter instead of the diode, allowing you to “break in” to the 4-20 mA circuit without having to physically break a wire connection anywhere. Making a mental note to thank your instrumentation instructor later for showing you this trick, you see that your multimeter registers 15.7 mA.
Given a calibrated temperature transmitter range of 100 to 200 °F, determine what this current measurement tells you about the location of the problem in this temperature control loop, and explain how you made that determination.
{\bullet} Why is it important for technicians to be able to easily convert milliamp signal values into corresponding process variable (PV) values?
{\bullet} How does the diode perform this useful function of allowing current measurement without breaking the circuit?
{\bullet} Supposing there were no diode in this loop circuit, how would you suggest we measure the transmitter’s output current?
{\bullet} Is it possible that the fault in this system could be something to do with the control valve? Why or why not?Reveal answerThe problem most likely lies within the controller (TIC).
The calculation for temperature based on the milliamp measurement taken and the known range of the temperature transmitter is as follows:
$$\left({15.7~mA - 4~mA \over 16~mA}\right) \times 100~^{\circ}F + 100~^{\circ}F = 173.1~^{\circ}F$$
To summarize, we take the measured current and subtract the live zero offset (4 mA), then divide by the span of the milliamp signal range (16 mA). This yields a fractional value representing 0 to 100 percent of measurement range. Multiplying this fractional value by the span of the measurement range (200 deg F - 100 deg F = 100 deg F) and lastly adding the zero offset of the measurement range (100 deg F) tells us the process temperature as interpreted by the transmitter, which in this particular case is 173.1 deg F.
This measured value is so close to the value of 172 deg F reported by the temperature gauge that we may safely conclude the transmitter is functioning properly. This means something else must account for the controller’s abnormal temperature reading. In other words, the transmitter is fine but the controller is falsely interpreting the 15.7 mA signal to mean a significantly higher temperature.
A couple of possibilities are as follows: perhaps the analog-to-digital converter circuitry inside the controller is faulty, causing the 4-20 mA current signal to be converted into an incorrect numerical value in degrees F. Alternatively, the resistor located on the controller for converting the 4-20 mA signal into a voltage drop for the analog-to-digital converter to read may be faulty, or have a loose wire connection to the controller’s terminal (adding extra resistance to the 4-20 mA loop and causing an excessive voltage drop which is then interpreted by the controller as a too-high temperature). Whichever the case, we know the transmitter is not at fault!
-
Question 21
Consider this control system, set up to maintain the temperature of a chemical reactor vessel at a constant (“setpoint”) value. The reactor’s source of heat is a steam “jacket” where hot steam is admitted through a motor-operated (M) control valve (TV) according to the temperature inside the reactor sensed by the temperature transmitter (TT):

You arrive at work one day to find the operator very upset. The last batch of product emptied from the reactor was out of spec, and the temperature displayed by the indicating controller (TIC) shows it to be 197 °F. The setpoint is set at 175 °F, and the controller is in the automatic mode as it should be.
Your first step is to look at the indication on the controller showing the output signal going to the motor-actuated steam valve (TV). This output signal display (the “manipulated variable”) shows 0
Next, you decide to check the temperature shown at the temperature indicator (TI) located near the temperature transmitter (TT) on the reactor. There, you see a temperature indication of 195 °F.
From this information, determine what is the most likely source of the problem, and explain how you made that determination.
{\bullet} Why is it important for us to know that the controller is in automatic mode? Would it make a difference if it were in manual mode instead?
{\bullet} Explain why the first two diagnostic steps were to check the controller’s output display, then to check the TI on the reactor. What do each of these checks tell us about the nature of the problem?
{\bullet} Suppose a fellow instrument technician were to suggest to you that the problem in this system could be a controller configured for the wrong action (e.g. direct action instead of reverse action). Do you think this is a plausible explanation for the symptoms reported here? Why or why not?Reveal answerThe problem most likely lies with the valve (TV).
From the data we have (temperature gauge, controller indication, and operator judgment), we know for a fact that the process temperature is too hot. We also know the controller is doing its job in outputting a 0
An important point to note here is that the controller output (MV) indication only tells you the signal being output by the controller to the final control element, and not necessarily the actual condition of that element. Just because the controller is sending out a 0
Another possibility is a problem with the controller’s output signal. If the DAC (digital-to-analog converter) has failed in such a way that causes the output current be falsely high, this could cause the same problem as a bad (stuck open) control valve. A power failure at the motor-operated valve is another fault possibility, causing the valve to hold at one position and be unresponsive to the controller’s output signal.
Yet another possibility is that the steam piping has a manual bypass valve shunting steam around the control valve, and that this valve has been left open. Manual bypass valves are normally used to provide process fluid flow in cases where the control valve must be removed from service. If such a valve were left on, it is possible for too much steam to heat up the reactor vessel, with no way for the automatic control system to shut it off.
Notes:This question is a good candidate for a “Virtual Troubleshooting” exercise. Presenting the diagram to students, you first imagine in your own mind a particular fault in the system. Then, you present one or more symptoms of that fault (something noticeable by an operator or other user of the system). Students then propose various diagnostic tests to perform on this system to identify the nature and location of the fault, as though they were technicians trying to troubleshoot the problem. Your job is to tell them what the result(s) would be for each of the proposed diagnostic tests, documenting those results where all the students can see.
During and after the exercise, it is good to ask students follow-up questions such as:
{\bullet} What does the result of the last diagnostic test tell you about the fault?
{\bullet} Suppose the results of the last diagnostic test were different. What then would that result tell you about the fault?
{\bullet} Is the last diagnostic test the best one we could do?
{\bullet} What would be the ideal order of tests, to diagnose the problem in as few steps as possible? -
Question 22
On the job, you are sent to troubleshoot a brand-new control system, consisting of a pneumatic liquid level transmitter connected to a pneumatic controller, which in turn drives a pneumatic control valve. The process vessel, piping, control valve, controller, and level transmitter are all brand-new: they even sport a fresh coat of paint.

According to the unit operator, this level control system has never worked. As she shows you, the liquid level inside the vessel is so low that the level gauge (LG) registers empty, yet the controller is commanding the valve 100
Being versed in process control theory, you decide to check how the controller is configured. Looking inside the controller case, you notice the controller is set for direct action: an increasing PV results in an increasing output signal (MV), which will move the air-to-close valve more toward the “closed” state.
Realizing how to fix the problem, you reach inside the controller and move a lever that switches it into reverse action mode.
Explain why this fixes the problem.
{\bullet} Explain the significance of the “newness” of this process. How would your assumptions differ if you saw this process vessel was old and rusted instead of shiny-new?
{\bullet} How do you suppose the controller got to be mis-configured in the first place?
{\bullet} What would have to be different in this control system to permit a direct-acting controller instead of a reverse-acting controller?
{\bullet} Suppose you did not discover the controller’s action set for direct action. If the controller had been left in manual mode instead of automatic mode, could this account for the problems exhibited by this system?Reveal answerThis was a real problem I encountered on the job, while working at an oil refinery!
A good diagnostic principle to keep in mind when approaching problems is to ask how new the malfunctioning system is. Faults in old systems tend to be quite different in nature from faults in brand-new systems. The fresh coat of paint on the process vessels and piping is a clue to troubleshooting the system: with it being so new, it probably never worked correctly, and so the fault is most likely some form of mis-configuration. In this particular case, the problem turned out to be incorrect controller action.
Faults in old (previously working) systems tend to be related to wear and tear rather than mis-configuration. Of course, it is always possible for someone to mis-configure an instrument in a system that previously worked for years, but this is unlikely because the problem(s) caused by that mis-configuration often appear immediately and are therefore easily corrected by the perpetrator.
The same rule holds true for mature systems recently rebuilt. When a process or a machine fails to operate normally after being rebuilt, the responsible fault(s) are most often related to mis-configuration or mis-installation rather than component aging.
Notes:This question is a good candidate for a “Virtual Troubleshooting” exercise. Presenting the diagram to students, you first imagine in your own mind a particular fault in the system. Then, you present one or more symptoms of that fault (something noticeable by an operator or other user of the system). Students then propose various diagnostic tests to perform on this system to identify the nature and location of the fault, as though they were technicians trying to troubleshoot the problem. Your job is to tell them what the result(s) would be for each of the proposed diagnostic tests, documenting those results where all the students can see.
During and after the exercise, it is good to ask students follow-up questions such as:
{\bullet} What does the result of the last diagnostic test tell you about the fault?
{\bullet} Suppose the results of the last diagnostic test were different. What then would that result tell you about the fault?
{\bullet} Is the last diagnostic test the best one we could do?
{\bullet} What would be the ideal order of tests, to diagnose the problem in as few steps as possible?{\bf Prep Quiz:}
Direct action for a process controller is defined as:
{\bullet} The process variable (PV) signal increases as the setpoint (SP) signal increases
{\bullet} The process variable (PV) signal decreases as the setpoint (SP) signal increases
{\bullet} The output (MV) signal decreases as the process variable (PV) signal increases
{\bullet} The output (MV) signal increases as the process variable (PV) signal increases
{\bullet} The setpoint (SP) signal increases as the process variable (PV) signal increases
{\bullet} The setpoint (SP) signal decreases as the process variable (PV) signal increases
{\bf Prep Quiz:}
Reverse action for a process controller is defined as:
{\bullet} The process variable (PV) signal increases as the setpoint (SP) signal decreases
{\bullet} The process variable (PV) signal decreases as the setpoint (SP) signal decreases
{\bullet} The output (MV) signal decreases as the process variable (PV) signal increases
{\bullet} The output (MV) signal increases as the process variable (PV) signal increases
{\bullet} The setpoint (SP) signal increases as the process variable (PV) signal increases
{\bullet} The setpoint (SP) signal decreases as the process variable (PV) signal increases